By ACCESS · Last updated: October 2, 2026 · Data current as of October 2, 2026
Irregular work schedules, part-time hours and lower wages shape who gets offered an employer medical plan, who goes uninsured, and who can actually get to a doctor during the week. This brief pulls the latest federal and national survey data into one citable place.
Key findings
- Part-time workers are far less likely to be offered an employer medical plan. In private industry, 87% of full-time workers had access to employer medical care benefits in March 2026, compared with 23% of part-time workers, a 64-percentage-point gap (calculation: 87 − 23). Source: BLS, Employee Benefits in the United States, March 2026.
- Access to a medical plan rises steeply with wages. Private industry workers in the lowest 25% average-wage category had 39% access, compared with 94% in the highest 25% category. Source: BLS, Employee Benefits in the United States, March 2026, Table 2.
- Workers off the full-time, year-round track go uninsured more often. In 2025, 13.9% of adults ages 19 to 64 who worked less than full-time, year-round were uninsured for the whole year, compared with 9.0% of full-time, year-round workers, about 1.5 times the rate (calculation: 13.9 ÷ 9.0 = 1.54). Source: U.S. Census Bureau, Health Insurance Coverage in the United States: 2025 (P60-291), Figure 6.
- Non-daytime work is concentrated in hourly-heavy industries. In 2024-25, 15% of wage and salary workers usually worked a non-daytime schedule. The figure was 23% for part-time workers (vs. 13% for full-time) and 40% in leisure and hospitality. Source: BLS, Job Flexibilities and Work Schedules 2024-2025.
- Many workers get little notice, and those who can't work from home report more difficulty stepping away. 9% of wage and salary workers learned their schedule one day or less in advance, rising to 32.2% of wage and salary workers in construction and extraction occupations (BLS Table 5). Among workers whose jobs can't be done from home, 40.8% said taking an hour or two off during work hours would be somewhat or very difficult, compared with 14.1% of those who could work from home (calculations: 25.9 + 14.9; 10.8 + 3.3). Sources: BLS release; Table 5; Table 4.
- Cost still keeps many adults from care, especially at lower incomes. 26% of adults went without some medical care in 2025 because they couldn't afford it, and 15% skipped seeing a doctor or specialist. Among adults with income under $25,000 the share was 38%, compared with 13% at $100,000 or more. Source: Federal Reserve Board, Economic Well-Being of U.S. Households in 2025.
Why this brief
Most employer health benefits are built around a predictable, full-time, daytime work week. A large share of the workforce doesn't work that way. In 2025, the Current Population Survey counted 28,566,000 part-time workers alongside 134,927,000 full-time workers (annual averages), so about 17.5% of employed people worked part time (calculation: 28,566 ÷ (134,927 + 28,566)). Source: BLS, Current Population Survey, Table 8, 2025 annual averages. In the Federal Reserve's 2025 survey, 16% of workers said their work schedule varied based on their employer's needs. Source: Federal Reserve Board, Economic Well-Being of U.S. Households in 2025, Employment and Job Quality.
This brief brings together the most recent public federal and national survey data on three questions:
- Eligibility: Are workers on part-time, lower-wage or irregular schedules offered an employer medical plan?
- Coverage: Are they covered at all?
- Reachability: When they have coverage, do their schedules and costs let them actually reach everyday care?
Every figure is quoted as its source published it, with a link. Where we combine figures, we show the arithmetic and label it as a calculation.
1. Who works part-time, shift and irregular schedules
- Non-daytime work is common. 85% of wage and salary workers worked a regular daytime schedule in 2024-25, and 15% usually worked a non-daytime schedule, "including 5 percent of workers who worked evenings and 3 percent who worked nights." Source: BLS, Job Flexibilities and Work Schedules 2024-2025.
- Part-time workers are almost twice as likely to work non-daytime hours, at 23% versus 13% for full-time workers (single jobholders). Same source.
- Non-daytime hours cluster by industry: leisure and hospitality (40%), transportation and utilities (25%), and wholesale and retail trade (20%). Same source.
- Lower-paid full-time workers also work more non-daytime hours. Among full-time single jobholders, 18.7% of those with earnings at or below the 25th percentile usually worked a non-daytime schedule, compared with 7.8% above the 75th percentile. Source: BLS, Table 7.
Figure 1. Where non-daytime schedules are most common
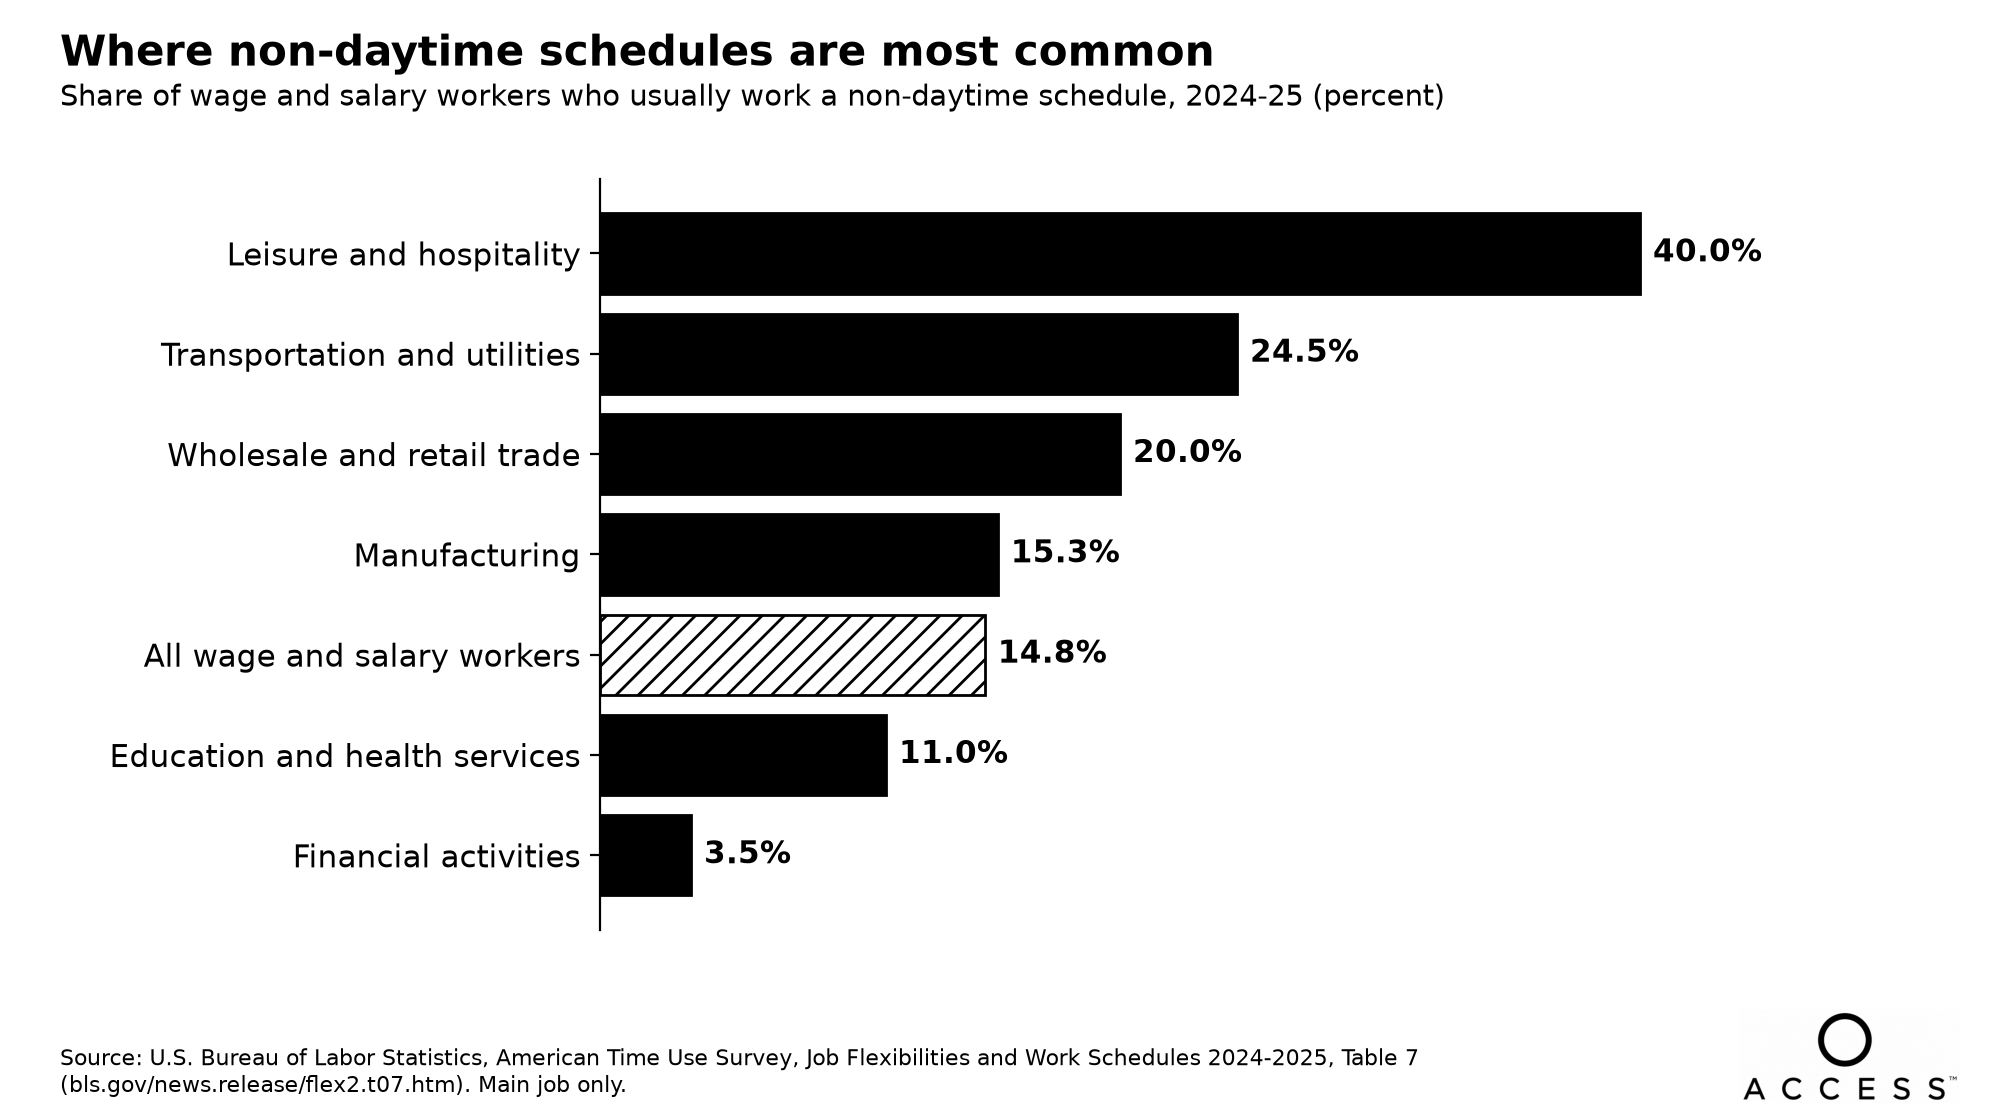
Data for Figure 1:
| Industry (main job) | % usually working a non-daytime schedule, 2024-25 |
|---|---|
| Leisure and hospitality | 40.0 |
| Transportation and utilities | 24.5 |
| Wholesale and retail trade | 20.0 |
| Manufacturing | 15.3 |
| All wage and salary workers | 14.8 |
| Education and health services | 11.0 |
| Financial activities | 3.5 |
Source: BLS, Job Flexibilities and Work Schedules 2024-2025, Table 7.
2. Benefits access follows hours and wages
- Overall, 71% of private industry workers had access to employer medical care plans in March 2026 and 46% participated. Source: BLS, Employee Benefits in the United States, March 2026.
- By hours: 87% of full-time versus 23% of part-time private industry workers had access (see Key findings). Across all civilian workers, including state and local government, the figures were 89% and 23%. Same source.
- By wage: access was 39% for the lowest 25% wage category and 94% for the highest 25% in private industry. For civilian workers in the lowest 10% wage category, access was 31%. Source: BLS, Table 2.
- By occupation and employer size: private industry service occupations had 47% access. Establishments with 1 to 49 workers had 55% access, compared with 90% at establishments with 500 or more workers. Same source.
- Eligibility inside offering firms. Even where a firm offers health benefits, not everyone can enroll. In KFF's 2025 survey, workers at firms with a relatively large share of lower-wage workers (at least 35% earning $37,000 a year or less) had a 67% average eligibility rate, compared with 83% at other firms. Eligibility at retail firms averaged 53%. Among firms with 200 or more workers that offer health benefits, 27% offered them to part-time workers. Source: KFF, 2025 Employer Health Benefits Survey.
Figure 2. Who is offered an employer medical plan?
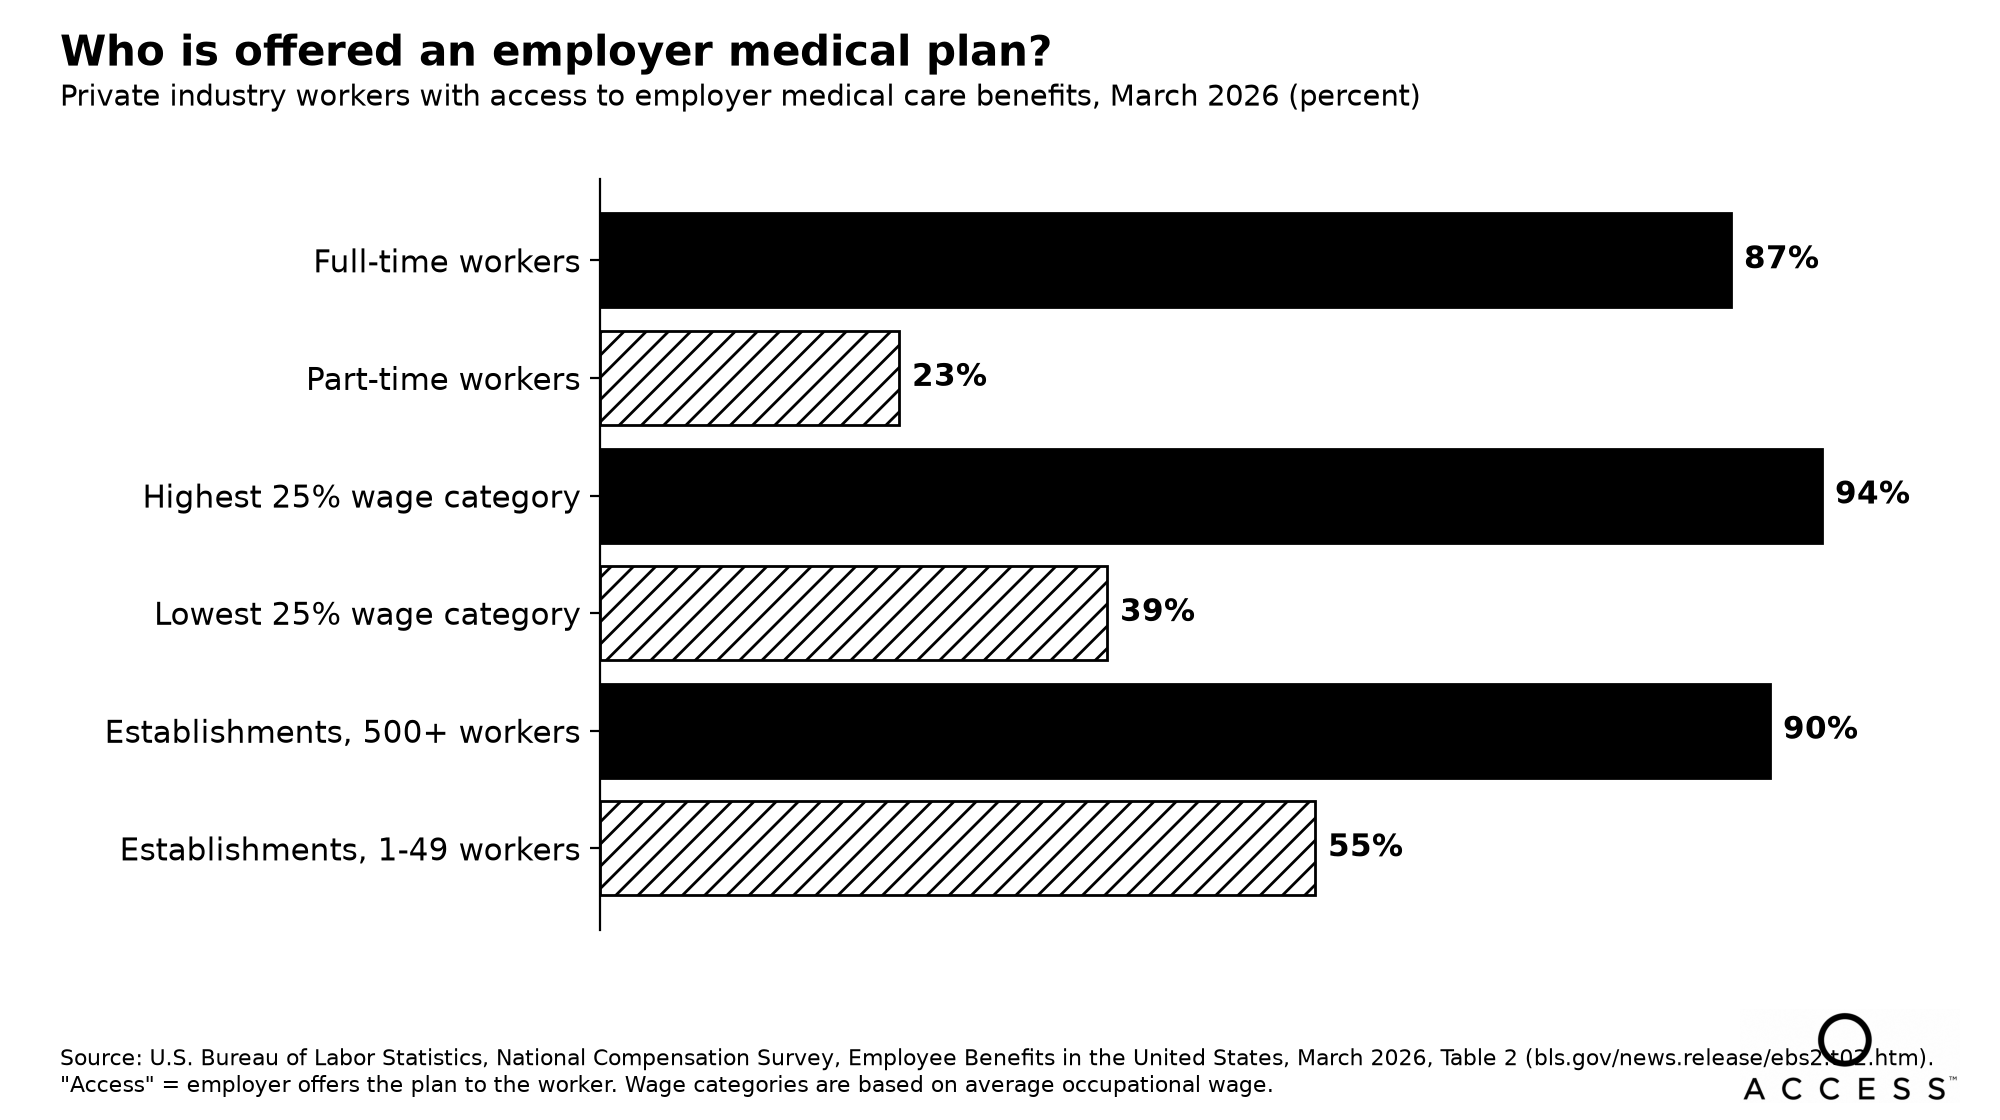
Data for Figure 2:
| Private industry group, March 2026 | % with access to employer medical care benefits |
|---|---|
| Full-time workers | 87 |
| Part-time workers | 23 |
| Highest 25% wage category | 94 |
| Lowest 25% wage category | 39 |
| Establishments, 500+ workers | 90 |
| Establishments, 1-49 workers | 55 |
Source: BLS, Employee Benefits in the United States, March 2026, Table 2.
3. Coverage gaps by work pattern
- Uninsured rates by work experience (2025, ages 19 to 64): 9.0% for full-time, year-round workers; 13.9% for those who worked less than full-time, year-round; 14.1% for those who did not work; 11.0% overall. Source: U.S. Census Bureau, P60-291, Figure 6.
- Type of coverage shifts, too. Among adults 19 to 64, 85.5% of full-time, year-round workers had private coverage, compared with 67.4% of those who worked less than full-time, year-round. Public coverage was 7.5% and 22.3%, respectively. Source: Census, P60-291, Figure 3.
- Region matters. The South had the highest working-age uninsured rate of any region, at 14.7%. Same source, Figure 6.
- National context: 26.7 million people (7.9%) were uninsured for all of 2025, and employment-based coverage was still the most common type, at 53.5% of the population. Same source.
Figure 3. Uninsured rates are higher off the full-time, year-round track
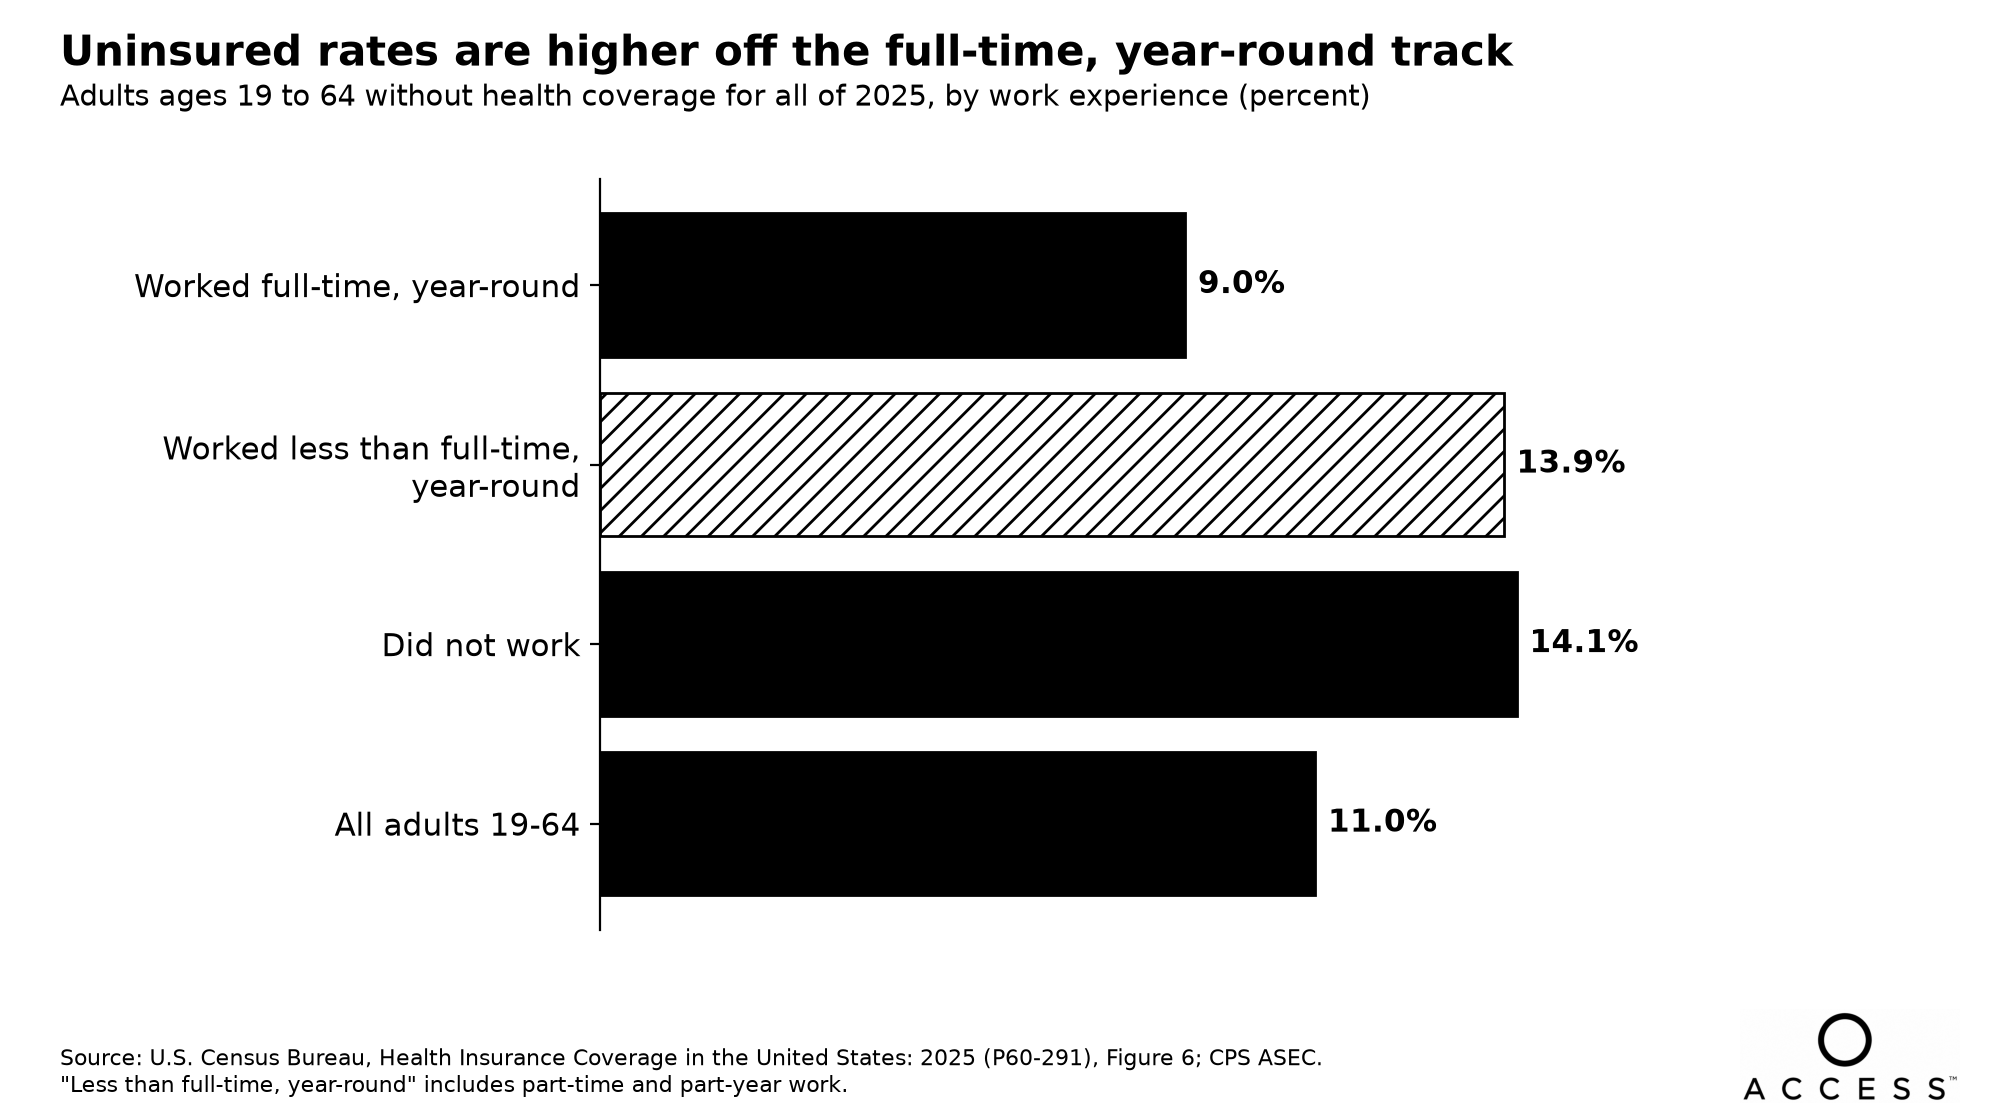
Data for Figure 3:
| Adults 19-64, 2025 | % uninsured for the entire year |
|---|---|
| Worked full-time, year-round | 9.0 |
| Worked less than full-time, year-round | 13.9 |
| Did not work | 14.1 |
| All adults 19-64 | 11.0 |
Source: U.S. Census Bureau, P60-291, Figure 6. Note on chart: "less than full-time, year-round" includes part-time and part-year work. These are calendar-year 2025 estimates; they don't reflect coverage changes during 2026.
4. Time and predictability: the practical barrier
Having coverage on paper doesn't settle whether a visit fits into the work week.
- Short notice: 59% of wage and salary workers knew their schedule four or more weeks ahead, and 9% learned it one day or less in advance. Source: BLS, Job Flexibilities and Work Schedules 2024-2025. In construction and extraction occupations, 32.2% of wage and salary workers learned their schedule one day or less ahead (Table 5, all wage and salary workers in the occupation). BLS's release text gives a different figure, 28%, because it describes a narrower group: construction and extraction workers without flexible schedules whose employers decided their schedules (Table 6, 28.3%). Sources: BLS release; BLS, Table 6. In leisure and hospitality, 21.8% knew their schedule four or more weeks ahead. Among part-time single jobholders that share was 38.5%, compared with 63.7% for full-time. Source: BLS, Table 5.
- Stepping away during the day: 69% of wage and salary workers said it would not be difficult to take an hour or two off during work hours, 20% said somewhat difficult, and 11% said very difficult. Source: BLS release. For workers who could not work from home, the shares were 59.2%, 25.9% and 14.9%. For those who could, they were 86.0%, 10.8% and 3.3%. In service occupations, 17.2% said very difficult, and in transportation and material moving occupations 16.6%. Source: BLS, Table 4.
Figure 4. Taking an hour off is harder when work can't be done from home
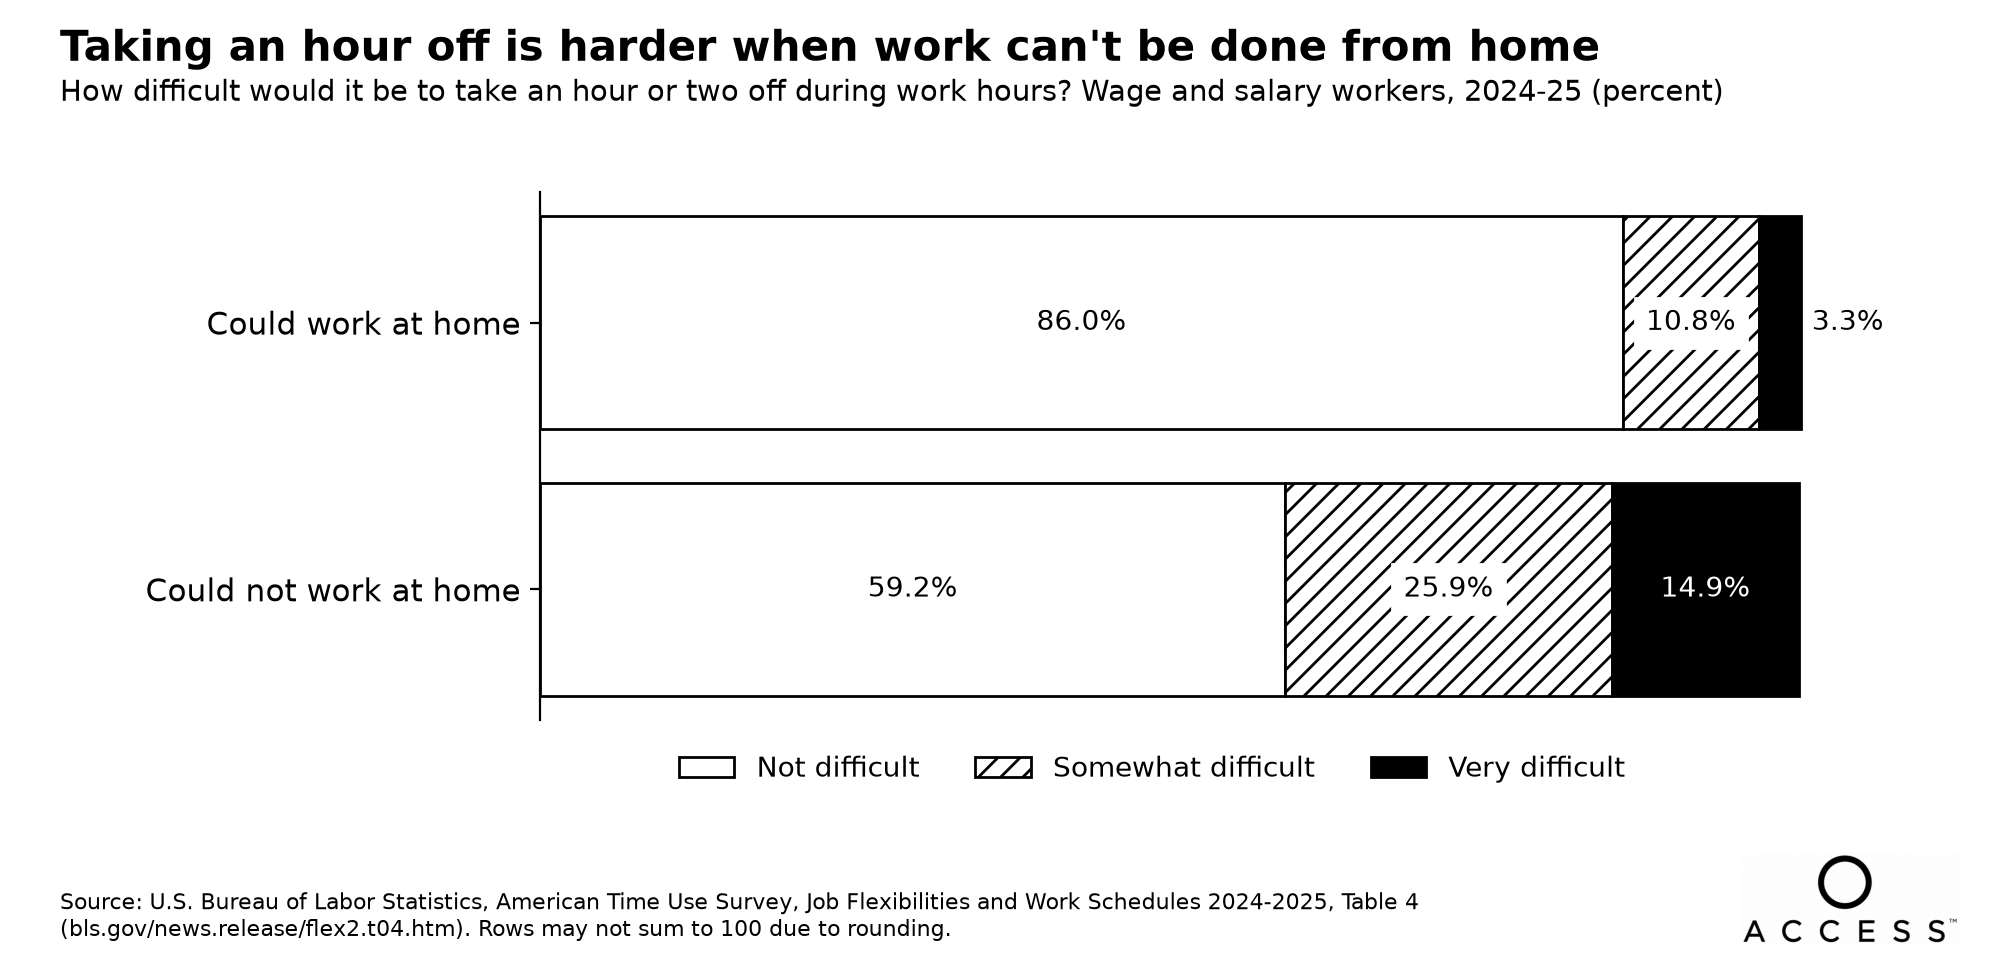
Data for Figure 4:
| Wage and salary workers, 2024-25 | Not difficult | Somewhat difficult | Very difficult |
|---|---|---|---|
| Could work at home | 86.0 | 10.8 | 3.3 |
| Could not work at home | 59.2 | 25.9 | 14.9 |
Source: BLS, Table 4.
Figure 5. How far ahead workers know their schedules
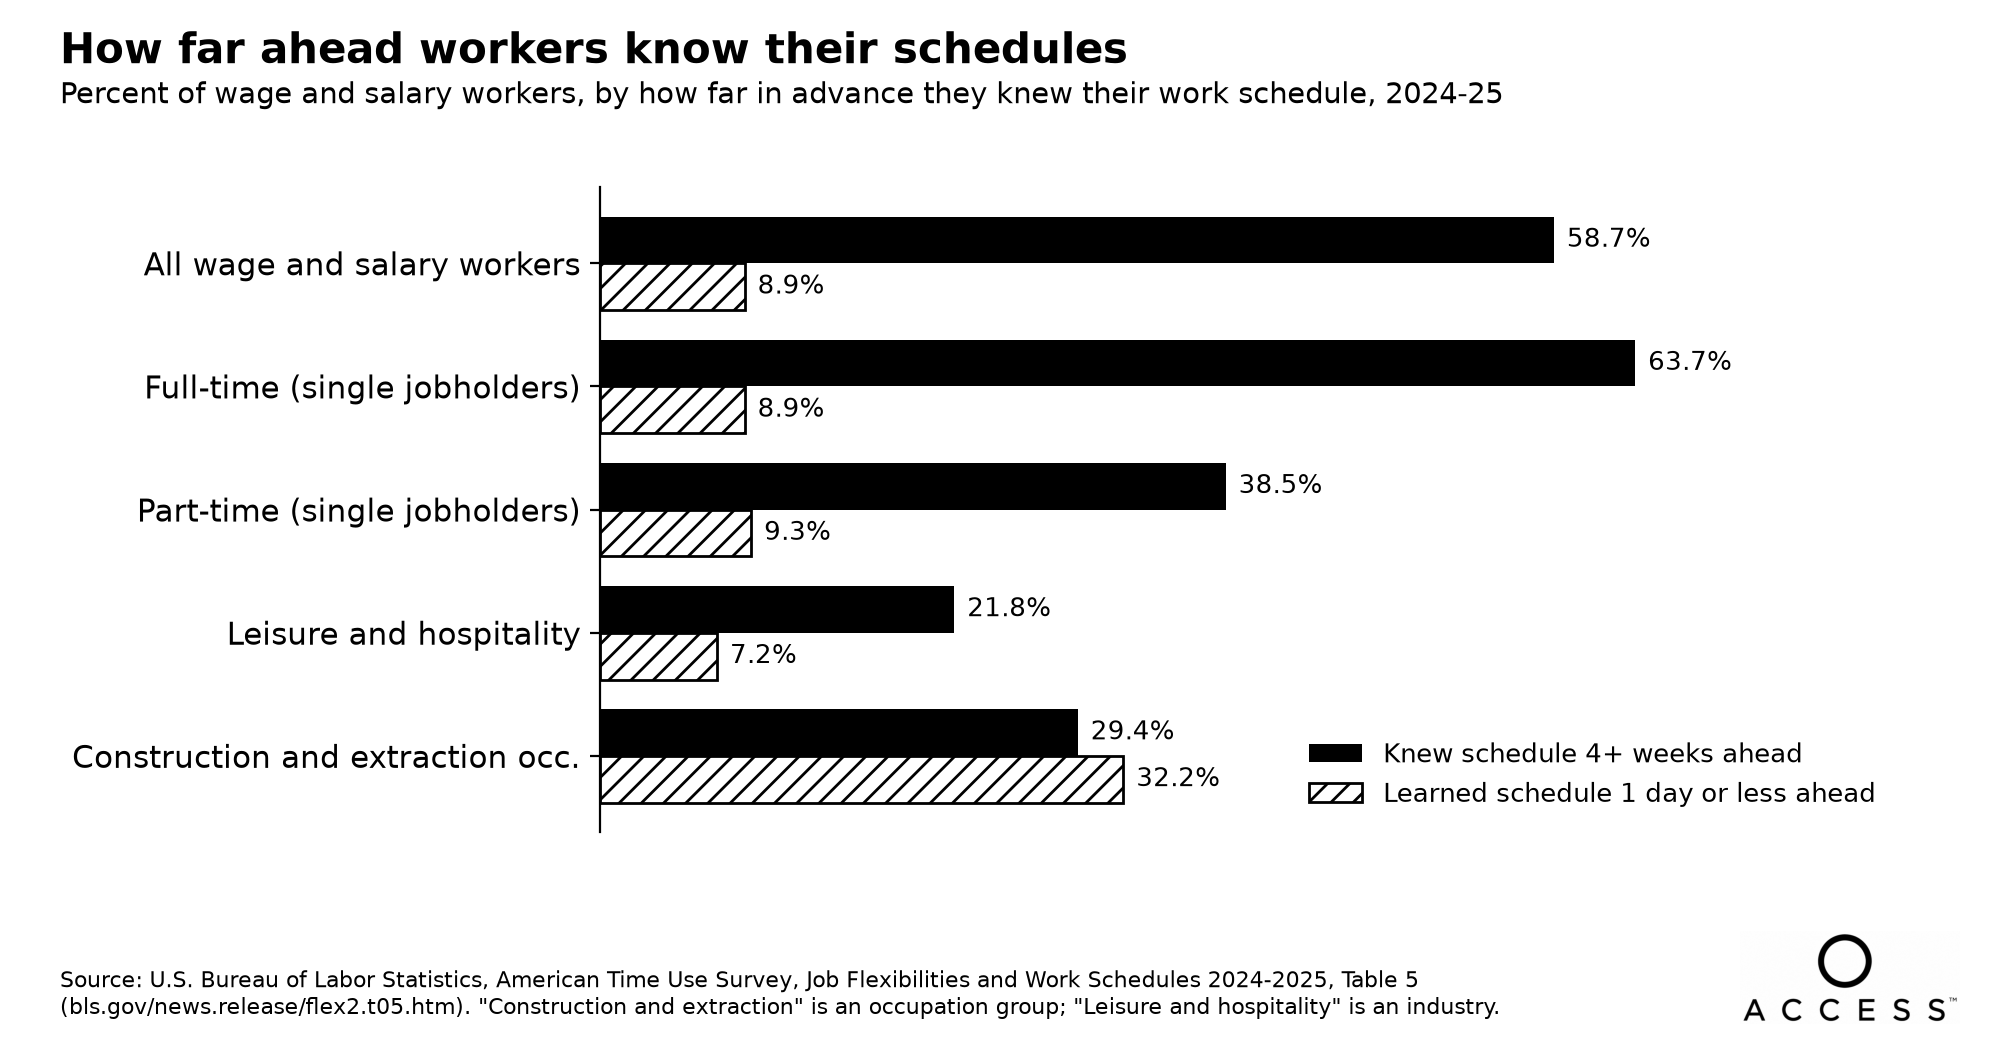
Data for Figure 5:
| Group, 2024-25 | % knew schedule 4+ weeks ahead | % learned schedule 1 day or less ahead |
|---|---|---|
| All wage and salary workers | 58.7 | 8.9 |
| Full-time (single jobholders) | 63.7 | 8.9 |
| Part-time (single jobholders) | 38.5 | 9.3 |
| Leisure and hospitality (industry) | 21.8 | 7.2 |
| Construction and extraction (occupation) | 29.4 | 32.2 |
Source: BLS, Table 5.
5. Cost: the other barrier
- Skipped care: 26% of adults went without some form of medical care in 2025 because they couldn't afford it (down from 28% in 2024). By type: dental care 18%, seeing a doctor or specialist 15%, follow-up care 10%, mental health care or counseling 10%, prescription medicine 9%. Source: Federal Reserve Board, Economic Well-Being of U.S. Households in 2025, Economic Hardships, Table 22.
- By income: 38% of adults with income under $25,000 went without some care because of cost, compared with 13% of adults making $100,000 or more, a 25-percentage-point gap (calculation: 38 − 13). Same source.
- By insurance status: 45% of uninsured adults went without care because of cost, compared with 24% of insured adults. Same source.
- A second federal measure: in the 2025 National Health Interview Survey, 6.0% of adults did not get needed medical care due to cost in the past 12 months. Source: CDC/NCHS, Early Release of Selected Estimates, 2025 NHIS. (The SHED and NHIS ask different questions in different ways, so their figures aren't directly comparable.)
- Cost-sharing for covered workers: the average deductible for single coverage was $1,886 in 2025 ($2,631 at firms with 10 to 199 workers), and 34% of covered workers had a single-coverage deductible of $2,000 or more (53% at firms with 10 to 199 workers). Source: KFF, 2025 Employer Health Benefits Survey.
- Premium share by wage: among private industry workers in family coverage, employees in the lowest 25% wage category paid 37% of the premium, compared with 28% in the highest 25% category, a 9-point gap (calculation: 37 − 28). For single coverage, the shares were 24% and 18%. Sources: BLS, Table 4; BLS, Table 3.
What the data do and don't show
- They show that the groups least likely to be offered an employer medical plan (part-time, lower-wage, small-establishment and service workers) overlap heavily with the groups most likely to work non-daytime, short-notice or inflexible schedules.
- They don't show a single, combined "access gap" number for irregular-schedule workers. No source in this brief measures schedule type, coverage and care use for the same people at the same time. We present the sources side by side and don't merge them into a new estimate.
What employers can do
These are general practices drawn from the data above. They aren't legal, tax or benefits advice; talk with your benefits advisor or counsel before changing plan eligibility or design.
- Map eligibility against your real schedules. List which roles, hour bands and locations are eligible for your medical plan, and compare that with how many people actually work those patterns.
- Ask your benefits advisor about variable-hour staff. How are their hours measured, and when are they offered the plan? This brief doesn't answer those questions. The companion 2027 Benefit-Cost Guide for Employers With Hourly Teams has a checklist of questions to bring.
- Treat time as a benefit design issue. If many roles can't be done from home, consider how people can attend a short appointment: shift-swap rules, paid or protected time for care, and care options that are reachable outside daytime hours.
- Give schedules as early as you can. Earlier notice makes it easier for people to book and keep appointments.
- Look at cost at the point of care, not only premiums. Deductibles and premium shares fall hardest on lower-wage employees, according to the KFF and BLS data above.
- Make everyday options easy to find. Put plan telehealth, nurse lines, employee assistance programs and other access points (such as virtual care or urgent care options) in one place, in plain language and in the languages your teams use.
- Ask employees. A short, anonymous pulse survey ("In the last 12 months, did you skip or delay care because of cost, time or your schedule?") gives you your own baseline. Keep responses out of individual records.
- Remember emergencies. Whatever everyday options you offer, remind employees that emergencies go to 911 or the nearest emergency department.
Methodology and sources note
- Sources: U.S. Bureau of Labor Statistics (National Compensation Survey, March 2026; American Time Use Survey Leave and Job Flexibilities Module, 2024-25; Current Population Survey, 2025 annual averages); U.S. Census Bureau (CPS ASEC, calendar year 2025); Federal Reserve Board (Survey of Household Economics and Decisionmaking, fielded Oct 17-28, 2025); CDC/NCHS (National Health Interview Survey 2025 early release); KFF (2025 Employer Health Benefits Survey, the latest edition published as of October 2, 2026).
- Exact figures: every number is quoted as published, including rounding. Where a source publishes both a rounded text figure and a one-decimal table figure (for example 59% vs 58.7%), the text uses the release wording and chart tables use the table values. Both are logged in the sources register. Where a release and a table describe different groups (the 28% vs 32.2% construction notice figures above), we name the table and the group.
- Calculations: differences, ratios and sums shown here are simple arithmetic on published figures, labeled "calculation." We didn't adjust, weight or extrapolate any estimate.
- Comparability: the sources cover different populations (all workers vs. wage and salary workers vs. adults), different periods (March 2026, calendar 2025, 2024-25 averages) and different question wording. Read figures within their own source.
- Data-collection note: BLS reports that 2025 CPS annual averages are 11-month averages that exclude October 2025, and that the 2024-25 ATUS module has no data for September 30 through November 11, 2025, because of the federal government shutdown. Sources: BLS CPS Table 8; BLS flex release.
- Definitions: "access" (BLS) means the employer offers the benefit to the worker; "uninsured" (Census) means not covered by any type of health coverage for the entire calendar year; "non-daytime schedule" (BLS) includes evening, night, rotating, irregular, split and other shifts.
- Snapshots: all source pages were retrieved on Oct 2, 2026 (ET) and archived; see the sources register for URLs and access times.
Frequently asked questions
What is an irregular work schedule? In federal data it usually means work outside a regular daytime schedule: evening, night, rotating, split or irregular shifts. BLS found that 15% of wage and salary workers usually worked a non-daytime schedule in 2024-25. (BLS)
Are part-time workers usually offered employer health benefits? Less often than full-time workers. In March 2026, 23% of part-time private industry workers had access to employer medical care benefits, compared with 87% of full-time workers. (BLS)
Are part-time workers more likely to be uninsured? Census data show that in 2025, 13.9% of adults 19 to 64 who worked less than full-time, year-round were uninsured for the full year, compared with 9.0% of full-time, year-round workers. (Census)
Why does schedule matter if someone has coverage? A visit still has to fit into the work week. In 2024-25, 11% of wage and salary workers said taking an hour or two off during work hours would be very difficult, and 9% learned their schedule one day or less in advance. (BLS)
How many adults skip care because of cost? In the Federal Reserve's 2025 survey, 26% of adults went without some medical care because they couldn't afford it. (Federal Reserve)
Can I reuse the charts and figures in this brief? Free to reuse with credit to ACCESS (accessghl.com) and the original data source.
About ACCESS
ACCESS is healthcare access infrastructure and membership, connecting patients, licensed providers, pharmacies, labs, employers and healthcare services through one secure platform. ACCESS is designed to sit beside the benefits people already have. ACCESS is a membership, not insurance, and it does not replace health coverage. It is not emergency care: in an emergency, call 911. Learn more about the ACCESS membership.
Talk with ACCESS about access for your team
This brief is general information based on public data. It is not medical, legal or tax advice. ACCESS did not collect any of the data reported here.
How to cite this brief
Suggested citation: ACCESS (2026). Irregular Schedules and the Care-Access Gap: A 2026 Data Brief. https://accessghl.com/blog/irregular-schedules-care-access-gap
When you use a figure, please cite the original federal or KFF source named next to it as well, and quote it as published (for example, "BLS, Job Flexibilities and Work Schedules 2024-2025, Table 5"). Last updated: October 2, 2026.
Reuse: Free to reuse with credit to ACCESS (accessghl.com) and the original data source.
Sources
- U.S. Bureau of Labor Statistics. Employee Benefits in the United States, March 2026 (USDL-26-1534), Sep 25, 2026. https://www.bls.gov/news.release/ebs2.nr0.htm; Table 2 https://www.bls.gov/news.release/ebs2.t02.htm; Table 3 https://www.bls.gov/news.release/ebs2.t03.htm; Table 4 https://www.bls.gov/news.release/ebs2.t04.htm
- U.S. Bureau of Labor Statistics. Job Flexibilities and Work Schedules - 2024-2025 (USDL-26-1533), Sep 24, 2026. https://www.bls.gov/news.release/flex2.nr0.htm; Tables 4, 5, 6, 7 https://www.bls.gov/news.release/flex2.t04.htm, https://www.bls.gov/news.release/flex2.t05.htm, https://www.bls.gov/news.release/flex2.t06.htm, https://www.bls.gov/news.release/flex2.t07.htm
- U.S. Bureau of Labor Statistics. Current Population Survey, Table 8, 2025 annual averages. https://www.bls.gov/cps/cpsaat08.htm
- U.S. Census Bureau. Health Insurance Coverage in the United States: 2025 (P60-291), September 2026. https://www2.census.gov/library/publications/2026/demo/p60-291.pdf
- Board of Governors of the Federal Reserve System. Economic Well-Being of U.S. Households in 2025, May 2026. Employment and Job Quality: https://www.federalreserve.gov/publications/2026-economic-well-being-of-us-households-in-2025-employment-and-job-quality.htm; Economic Hardships: https://www.federalreserve.gov/publications/2026-economic-well-being-of-us-households-in-2025-economic-hardships.htm
- CDC/National Center for Health Statistics. Early Release of Selected Estimates Based on Data From the 2025 National Health Interview Survey. https://www.cdc.gov/nchs/data/nhis/earlyrelease/Early-Release-of-Selected-Estimates-Based-on-Data-from-the-2025.pdf
- KFF. 2025 Employer Health Benefits Survey, Oct 22, 2025 (latest edition available as of October 2026). https://www.kff.org/health-costs/2025-employer-health-benefits-survey/